Content Information
On this page...
- 2B-1 Quick Tips
- 2B-2 Superelevation (e)
- Side Friction Factor
- Distribution of Superelevation (e) and Side Friction (f)
- Axis of Rotation
- Undivided Roadway
- Divided Roadways
- Superelevation Transitions
- Superelevation Transition Considerations for Pavement Drainage
- 2B-3 Superelevation Tables
- Table 1: Low Speed, Two Lane Undivided Roadways (w = 12 feet), emax = 6%, NC = 2%
- Table 2: High Speed, Two Lane Undivided Roadways (w = 12 feet), emax = 6%, NC = 2%
- Table 3: High Speed, Four Lane Divided Roadways (w = 24 feet), emax = 6%, NC = 2%
- Table 4: High Speed, Six Lane Divided Roadways (w = 36 feet), emax = 6%, NC = 2.5%
- Table 5: High Speed, Eight Lane Divided Roadways (w = 48 feet), emax = 6%, NC = 2.5%
- Table 6: Ramps (w = 16 feet) and Loops (w = 18 feet), emax = 6%, NC = 2%
- Table 7: Ramps (w = 24 feet), emax = 6%, NC = 2%
- Table 8: Low Speed Roadways (w = 12 feet), emax = 8%, NC = 2%
- Table 9: High Speed Roadways (w = 12 feet), emax = 8%, NC = 2%
- Table 10: Minimum Radii, Low Speed Roadway
- Chronology of Changes
2B-1 Quick Tips
For roadways with a design speed greater than 45 mph, use distribution Method 5. Superelevation rate should be no greater than 6% for new construction.
For roadways with a design speed of 45 mph or less, use distribution Method 2. Even though this is the Design Bureau’s best practice, this method may be optional for urban roadways.
Submit design exceptions for superelevation rates that are less than the values shown in the superelevation tables in Section 2B-3.
2B-2 Superelevation (e)
Superelevation is the banking of a roadway along a horizontal curve. An adequate superelevation will allow motorists maneuver a curve at reasonable speeds safely and comfortably. Design a steeper superelevation rate if speeds increase, or horizontal curves become tighter.
In Iowa the superelevation rate is limited to a maximum of 8%. This reduces the risk of slow moving vehicles sliding down a superelevated roadway during winter conditions. For new construction, the superelevation rate is limited to 6%, which allows the shoulders to slope away from the driving lanes without exceeding AASHTO’s 8% maximum value for crossover breaks. The superelevation rate for new urban facilities is usually limited to 4% due to the frequency of cross streets, driveways, and entrances adjoining the curve, as well as the possibility of vehicles stopping on the curve at signalized intersections.
See the Selecting Design Criteria Section (1C-1) to select the design criteria for maximum superelevation rates for 3R projects and new construction or reconstruction projects.
Definitions
Side Friction - the friction force between a vehicle’s tires and the pavement which prevents the vehicle from sliding off the roadway.
Axis of Rotation - the point on the cross section about which the roadway is rotated to attain the desired superelevation.
Superelevation Rate (e) - the cross slope of the pavement at full superelevation.
Superelevation Runoff Length (L) - the length required to change the cross slope from 0% to the full superelevation rate.
Tangent Runout Length (x) - the length required to change the cross slope from 0% to the normal cross slope.
Relative Gradient (G) - the slope of the edge of pavement relative to the axis of rotation.
Width (w) - the distance from the axis of rotation to the outside edge of traveled way.
Figure 2B.1 shows these definitions graphically.
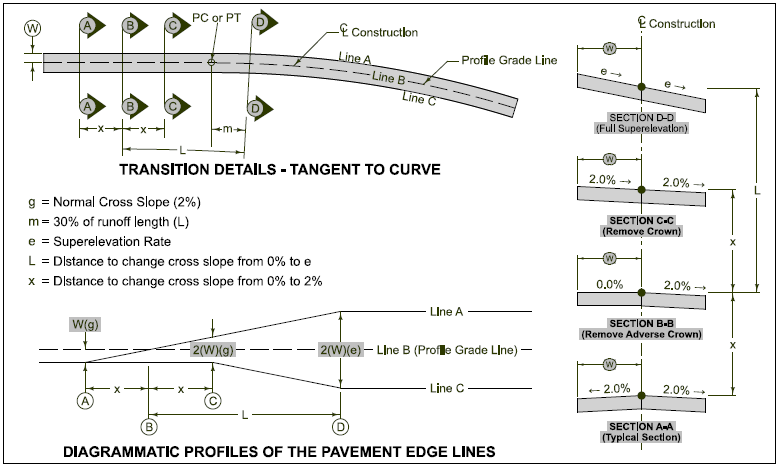
Figure 2B.1: Graphical definitions of superelevation terms for a two-lane roadway.
See the PV-300 Series Standard Road Plans for superelevation details.
Back to topSide Friction Factor
Superelevation rate and side friction demand, also referred to as the side friction factor, establish radii for horizontal curves. Side friction factor represents the friction between the tires and pavement surface. This friction results in a lateral acceleration that acts upon a vehicle, and which occupants within the vehicle can feel. Like superelevation, side friction factor is limited for design speeds.
Maximum Side Friction Factors (fmax)
Consider the vehicle’s need for side friction, and driver comfort, when establishing the maximum side friction factor to use for horizontal curve design.
Side Friction (vehicle’s need)
A vehicle will begin to skid when the side friction demand equals or exceeds the maximum amount of friction that can be developed between the tires and the pavement. This maximum friction, with a factor of safety to account for variations in the speed, tire conditions, and pavement conditions, is the maximum design friction factor based upon vehicle need.
Side Friction (driver comfort)
Through a horizontal curve, drivers can experience a feeling of being pushed outward. If this feeling becomes uncomfortable, the driver will compensate by flattening out their path or braking, or both, to reduce lateral acceleration to an acceptable level. Often, the driver’s comfort determines superelevation requirements, not the vehicle and roadway characteristics. On low speed roadways, drivers will accept more lateral acceleration, thus permitting a larger side friction factor. As speed increase, drivers become less tolerant of lateral acceleration, requiring a reduction inside friction factor.
Based upon research of the above factors, Table 2B.1 lists maximum side friction factors for use in design of horizontal curves.
Table 2B.1: Maximum side friction factors (fmax).

| Curves should not be designed with side friction factors greater than the values shown in Table 2B.1. |
|---|
Distribution of Superelevation (e) and Side Friction (f)
Chapter 3 of the AASHTO Greenbook discusses five methods of controlling lateral acceleration on curves using e, f, or both. Iowa DOT uses distribution Method 2 and Method 5 depending on the type of roadway.
Low Speed Roadways
Method 2 is commonly used for low speed roadways. With Method 2, side friction is primarily used to control lateral acceleration, and superelevation is added to radii after the maximum side friction factor has been used. Superelevation is not needed for radii that require less than the maximum friction factors shown in Table 2B.1.
Distribution Method 2 increases the lateral acceleration, creating some additional discomfort to the driver for some curves.
In urban areas, drivers are willing to accept more discomfort due to the anticipation of more critical conditions. In addition, several factors make it difficult, if not impossible, to apply superelevation to urban roadways:
Frequency of cross streets and driveways.
Vehicles stopping on curves at signalized intersections.
Meeting the grade of adjacent properties.
Surface drainage.
Pedestrian ramps.
Wider pavement area.
High Speed Roadways
Method 5 is used for high speed roadways. With Method 5, side friction and superelevation are both applied using a curvilinear relationship with the inverse of the radius.
At higher speeds, drivers are less comfortable with lateral acceleration through curves. Method 5 works well for determining the distribution of superelevation and side friction for high speed roadways because superelevation is progressively added as speed increases.
Superelevation tables for high speed roadways are included in Section 2B-3. The superelevation rate for Method 5 distribution can also be calculated manually using the equations provided in Chapter 3 of the AASHTO Greenbook. An excel file has been created using these formulas and is accessed using the link below.
Superelevation Spreadsheet (22.44 KB) .xlsx
Ramps
Method 2 superelevation distribution is also well suited for curves on ramps near at-grade terminals. Curves near at-grade terminals are usually short, and drivers are traveling at reduced speeds.
The relationship between superelevation rate and minimum radius for Method 2 distribution can be expressed as follows:
\(R = \frac{V^2}{15(0.01e + f_{\max})}\)
where:
V = design speed, mph
e = superelevation rate, %
fmax = maximum friction factor for the design speed
R = Radius of the curve, feet
Superelevation table 10 on Section 2B-3 provides minimum turning radii for various superelevation rates and design speeds, based upon Method 2 distribution.
Method 5 superelevation distribution should be used for curves on ramps near free flow terminals and curves on directional and semi-directional ramps.
Back to topAxis of Rotation
The axis of rotation is the point on the cross section about which the roadway is rotated to attain the desired superelevation. For standard situations, the axis of rotation is shown on the appropriate Standard Road Plan in the PV-300 Series.
|
| For cases not covered by the Standards, the axis of rotation should be clearly shown on the typical cross section and modified superelevation detail. |
|---|
Undivided Roadway
Undivided roadways should be superelevated with the axis of rotation at the roadway’s centerline (see Figure 2B.2).

Figure 2B.2: The axis of rotation for undivided highways.
Highways with painted medians are rotated about the centerline.
Back to topDivided Roadways
Depressed Medians
Multi-lane roadways with depressed medians should be superelevated with the axis of rotation at the median edges of the traveled way (see Figure 2B.3). With this method, the cross section of the median remains relatively uniform. This method is also used for two lane roadways that will ultimately become one direction of a divided highway.

Figure 2B.3: The axis of rotation for multilane highways with depressed medians.
Although the AASHTO Greenbook suggests moving the axis of rotation back to the roadway centerlines for wider medians, the Design Bureau’s policy is to keep the axis of rotation at the median edge of the traveled way, regardless of the median width. This method may require additional earthwork, but it is preferred for reasons of constructability, simplicity of design, and the appearance of a uniform median cross section. Facilities that have wide medians with independent profile grades and/or construction centerlines may be treated as two lane (undivided highways) if the resulting median cross section is acceptable.
Closed Medians
Roadways with closed medians (concrete barrier rail) should be superelevated with the axis of rotation at the inside edge of the travel way with the profile grade at the centerline of the roadway. Maintaining a uniform cross section for the median pad is preferred to simplify design and construction by having a roadway without a split median barrier.
With this method, to maintain a uniform median pad cross section and to maintain high side and low side shoulder treatments described in the Shoulder Cross Slope Section (3C-3), the axis of rotation profile reference line does not coincide with the profile grade line. The axis of rotation profile reference line is also not shown as a horizontal line like other roadways without a closed median. See the PV-300 Series Standard Road Plans .
Ramps
The axis of rotation for ramps should be at the baseline. The baseline is usually located to the right of the direction of travel.
Back to topSuperelevation Transitions
To provide comfort and safety, superelevation should be introduced and removed uniformly. The distance required to transition into an out of superelevation is a function of the relative gradient, width of pavement rotated and superelevation rate.
Relative Gradient
The slope of the edge of pavement relative to the axis of rotation is referred to as the relative gradient (G). Figure 2B.4 shows the relationship between superelevation runoff (L), superelevation (e), and pavement width (w).
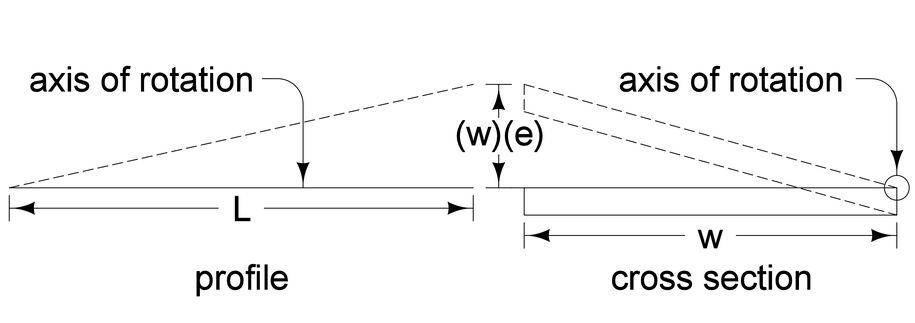
Figure 2B.4: Runoff length and superelevation.
From Figure 2B.4, the following formula can be derived:
\(G = \frac{w \times e}{L}\)
where:
G = relative gradient (%)
w = lane width (ft.)
e = full superelevation (%)
L = runoff length (ft.)
Maximum design values for the relative gradient are shown in Table 2B.2.
Table 2B.2: Maximum relative gradients.
Superelevation Runoff Length
Runoff length is the length required to transition the outside lane(s) of the roadway from a zero (flat) cross slope to full superelevation, or vice versa. The following formula is used to determine the runoff length.
\(L = \frac{12e}{G}\,\alpha\)
where:
L = runoff length (ft.)
e = full superelevation (%)
G = Relative gradient (%)
α = adjustment factor (dimensionless) to account for the number of lanes being rotated.
The adjustment factor α for different roadway widths can be calculated manually using the following equation:
α = 1 + 0.0417(w – 12)
where:
w = the distance from the axis of rotation to the outside edge of traveled way (ft).
See Table 2B.3 for adjustment factors for common roadway widths.
Table 2B.3: Adjustment factor for common roadway widths.
Runout Length
The runout length (x) is the length required to transition the outside lane(s) of the roadway from a normal crowned section to a point where the outside lane(s) have zero (flat) cross sloped, known as the point where the roadway removes adverse crown. For consistency, the same relative gradient is used. This means the ratio of the runout length to the runoff length is the same as the ratio of the normal cross slope to the full superelevation runout.
\(\frac{x}{L} = \frac{g}{e}\)
where:
x = runout length, feet
L = superelevation runoff length, feet
g = normal cross slope, %
e = full superelevation, %
From this, the runout length is determined as:
\(x = \frac{g}{e}L\)
Placing Superelevation Transition
How superelevation transition is placed is critical to driver safety and comfort. If all the transition is placed prior to the curve, the driver, while on the tangent, is forced to steer in a direction opposite the curve to avoid drifting into opposing lanes. If all the superelevation transition is placed in the curve, the lateral acceleration the driver experiences upon entering the curve may be intolerable. In addition, side friction may not be sufficient to prevent the vehicle from skidding off the road.
The Design Bureau’s practice is to place 70 percent of the superelevation runoff length on the tangent section of the roadway and 30 percent on the curve. The variable (m) in the Standard Road Plans represents the 30 percent of the superelevation runoff developed on the curve. Superelevation at the PC or PT of a curve is equal to 0.70(e).
Other proportions (50 percent to 80 percent) of the runoff length placed on the tangent section are acceptable where site conditions do not allow 70 percent. If site conditions require this, the designer must include a detail sheet in the plans outlining the nonstandard proportion.
Auxiliary Lanes
Low Side of Superelevated Roadways
Acceleration lanes on the low side of a superelevated roadway should have the same cross slope as the adjacent pavement and match the superelevation rate of transition.
High Side of Superelevated Roadways
Acceleration lanes on the high side of a superelevated roadway preferably should have the same cross slope as the adjacent pavement. Normally the cross slope of an acceleration lane will need to transition downward from the adjacent pavement near an intersection, creating a crossover crown line. Desirably the algebraic difference in the crossover crown line should be limited to 4 or 5 percent. Table 2B.4 suggests the maximum differences in crossover crown lines, related to the speed of the turning roadway at an intersection.
Table 2B.4: Maximum algebraic difference in cross slope at turning roadway terminals.
Cross Slope Transition
Preferably the cross slope rate of transition for the auxiliary lane should equal the cross slope rate of transition of the adjacent pavement. In areas near an intersection, a faster rate of transition may be desirable.
Designers should refer to Table 2B.2 for the maximum grade change in the profile edge of pavement to determine the maximum rate of transition per station.
Example: If the design speed of the limiting curve of a turning roadway has a design speed of 15 mph, the relative gradient of the edge of pavement is 0.89 (1:112.5). This results in a rate of change in cross slope of 7.4% for a 12 foot lane per station (100 ft).
\(\frac{L \times G}{W} = \frac{100 \times 0.89}{12} = 7.4\%\)
Shoulder Treatment in Superelevated Curves
Low Side Shoulders
Shoulders on the low side of superelevated roadways should slope away from the roadway. The normal cross slope of the shoulder should be maintained until the cross slope of the roadway exceeds the normal shoulder cross slope. The transition of the shoulder cross slope should equal the transition rate of the roadway.
For example, if the mainline pavement is superelevated at 5%, the low side shoulder would slope away at 5%. The shoulder cross slope transition would begin where the mainline pavement cross slope equals the normal cross slope of the shoulder and transition at an equivalent superelevation transition rate.
High Side Shoulders
Shoulders on the high side of superelevated curves should slope away from the roadway. The normal cross slope of the shoulder should be maintained until the algebraic difference between the cross slope of the shoulder and the cross slope of the roadway reaches 8%. Once the algebraic difference in cross slope reaches 8%, the shoulder cross slope should transition up at an equivalent transition rate as the adjacent roadway to maintain the 8% algebraic difference. For example, if the mainline pavement is superelevated at 6%, the high side shoulder should slope away at 2%.
If the superelevation rate exceeds 7%, maintain a 1% shoulder cross slope away from the adjacent pavement. For example, if the mainline pavement is superelevated at 8%, the high side shoulder should slope away at 1%.
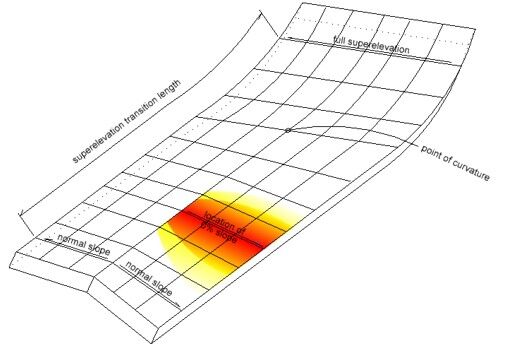
Back to topSuperelevation Transition Considerations for Pavement Drainage
To achieve superelevation, the pavement surface must rotate through an area of zero cross slope. These areas of zero cross slope are critical for consideration. These areas can occur at or near where the forces exerted by a vehicle are changing due to a change in the vehicle path. If this occurs in a flat area within the profile, the result can be an area of pavement that does not drain well. This can occur near the turning point of a crest or sag, or within a tangent section of profile. In this case, the transition edge slope ratio acts with the profile to create almost a flat area.
Designers should avoid these situations as much as possible by:
- Providing adequate running slope.
- Avoiding placing the flat location of a vertical curve coincident with the area of no cross slope.
On some occasions, project constraints make this occurrence necessary. In these locations, designers should be aware of the implications this holds.
Newly placed pavement will provide adequate surface friction in areas of no cross slope. However, as the surface wears over time, the loss of surface friction can result in undesirable conditions.
The Superelevation Transition Tool (21M-51) has been developed to assist with the review of these areas.
The output provided by this tool should be saved as project documentation for both ends of every superelevated curve within a project.
Back to top2B-3 Superelevation Tables
Table 1: Low Speed, Two Lane Undivided Roadways (w = 12 feet), emax = 6%, NC = 2%
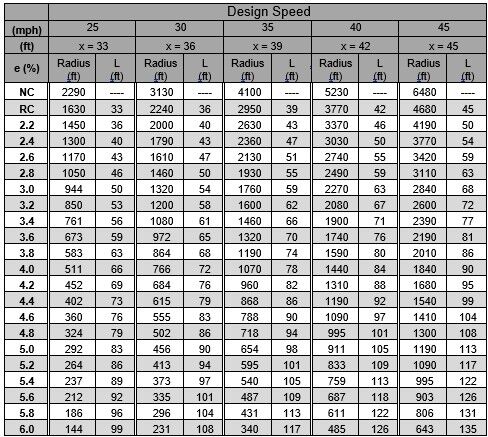
Table 2: High Speed, Two Lane Undivided Roadways (w = 12 feet), emax = 6%, NC = 2%
Table 3: High Speed, Four Lane Divided Roadways (w = 24 feet), emax = 6%, NC = 2%
Table 4: High Speed, Six Lane Divided Roadways (w = 36 feet), emax = 6%, NC = 2.5%
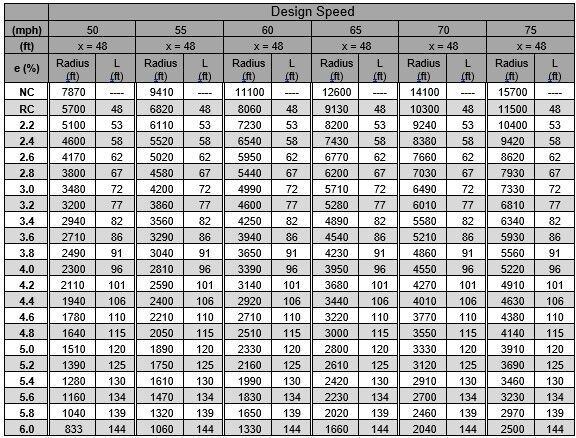
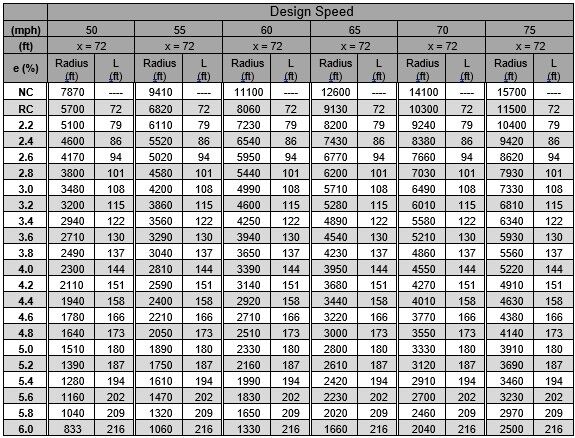
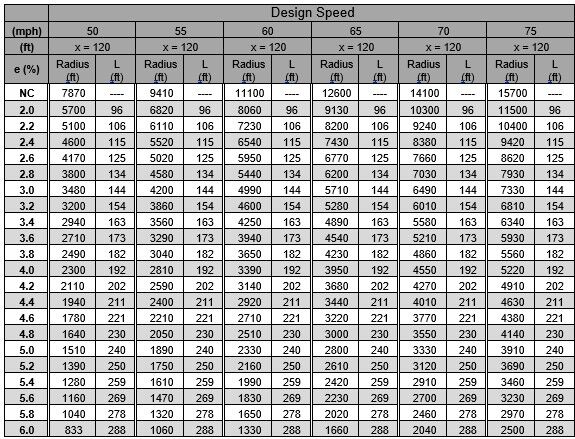
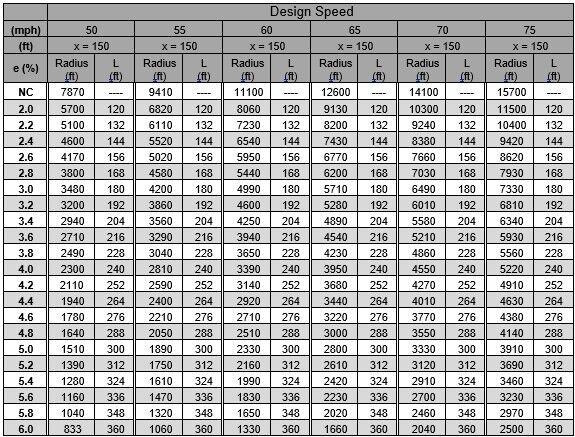
Table 5: High Speed, Eight Lane Divided Roadways (w = 48 feet), emax = 6%, NC = 2.5%
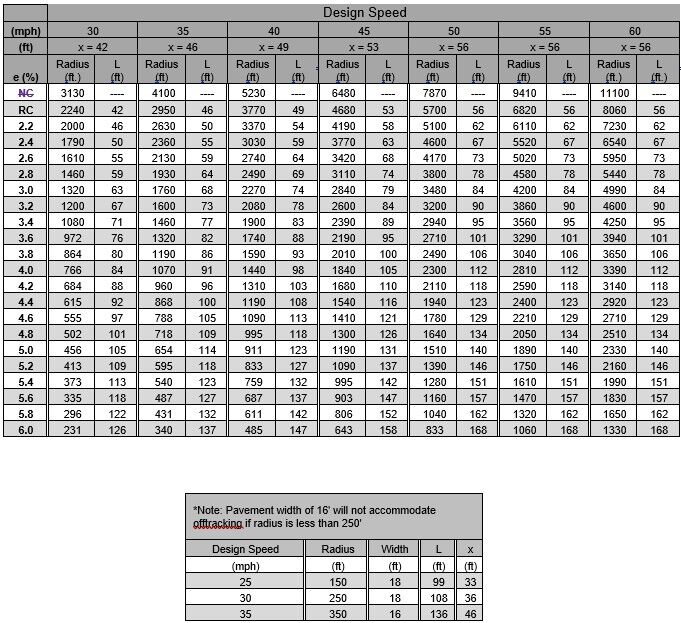
Table 6: Ramps (w = 16 feet) and Loops (w = 18 feet), emax = 6%, NC = 2%
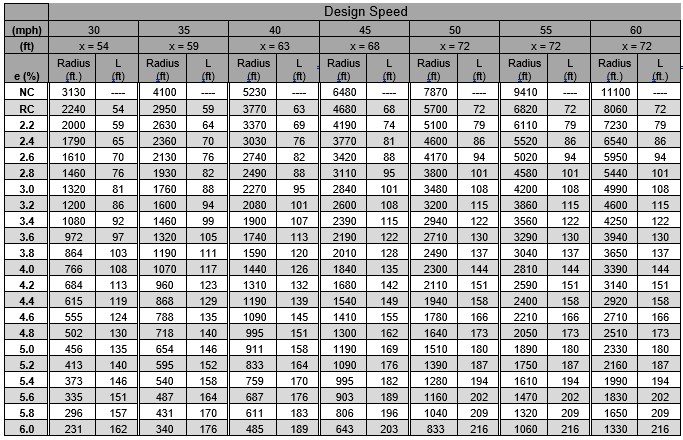
Table 7: Ramps (w = 24 feet), emax = 6%, NC = 2%
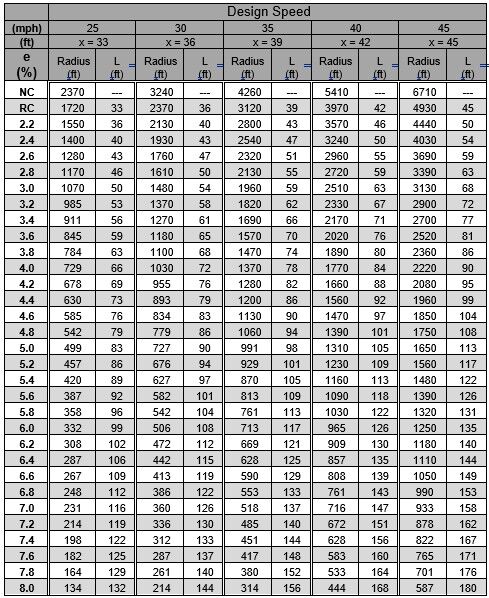
Table 8: Low Speed Roadways (w = 12 feet), emax = 8%, NC = 2%
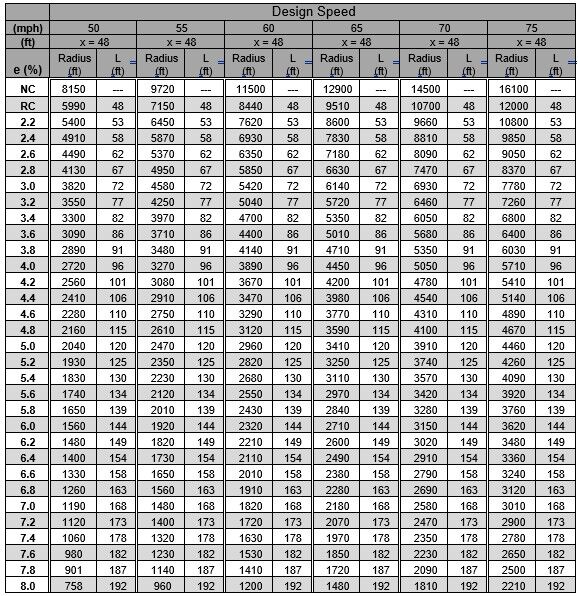
Table 9: High Speed Roadways (w = 12 feet), emax = 8%, NC = 2%
Table 10: Minimum Radii, Low Speed Roadway
The Design Bureau uses Superelevation Tables 1 through 10 to determine the following:
- Minimum radii for design superelevation rates in feet (ft).
- Minimum superelevation runoff length (L) in feet (ft).
- Minimum tangent runout length (x) in feet (ft).
Values of L and x are rounded to the nearest foot. Values of e are rounded up to the nearest two-tenths of a percent (%). L and x for a given design speed should not be less than the minimums indicated on the tables. Tangent runout length is based on a normal cross slope (NC), of either 2 or 2.5 (%). See Superelevation Transitions in Section 2B-2, to determine tangent runout lengths for normal cross slopes other than 2 or 2.5 (%).
When using superelevation tables for a given radius, interpolation is not necessary because the superelevation rate should be determined for a radius equal to, or slightly smaller than the desired radius.
Example: The roadway is a two lane undivided roadway with a NC of 2%. What would be the design superelevation rate for a 50 mph curve given a maximum superelevation rate (emax) of 6% and a calculated radius of 2,120 (ft).?
Method: See Table 2B.5
From Superelevation Table 2, under the 50 mph, select 2,110 feet, which is a radius slightly smaller than 2,120 feet. The superelevation rate is 4.2%, L is 101 feet, and x is 48 feet.
Table 2B.5: Determine superelevation (e).
Superelevation Tables 1 and 2 provide values of (L) and (x) for roadways with an emax of 6% and a pavement width of 12 feet.
Superelevation Tables 8 and 9 provide values of (L) and (x) for roadways with an emax of 8% and a pavement width of 12 feet. These tables are primarily used for 3R and 4R projects.
Superelevation Table 10 contains values for a range of superelevation rates for low speed roadways, for which Method 2 is used to distribute side friction and superelevation.
Table 2B.3 provides a method on how to use the adjustment factor (α) to determine values of (L) and (x) for roadway widths other than 12 feet. Multiply the values of (L) and (x) obtained from the tables by the appropriate adjustment factor (α).
|
| Do not use superelevation rates less than the values shown in the tables for a given radius. Designers may exceed the values shown but should consult with the Geometrics Coordinator in the Methods Section. |
|---|
Back to top
Table 1: Low Speed, Two Lane Undivided Roadways (w = 12 feet), emax = 6%, NC = 2%
Low Speed, Two Lane Undivided Roadways (130.38 KB) .pdf
Back to top
Table 2: High Speed, Two Lane Undivided Roadways (w = 12 feet), emax = 6%, NC = 2%
High Speed, Two Lane Undivided Roadways (142.6 KB) .pdf
Back to top
Table 3: High Speed, Four Lane Divided Roadways (w = 24 feet), emax = 6%, NC = 2%
High Speed, Four Lane Divided Roadways (142.51 KB) .pdf
Back to top
Table 4: High Speed, Six Lane Divided Roadways (w = 36 feet), emax = 6%, NC = 2.5%
High Speed, Six Lane Divided Roadways (142.23 KB) .pdf
Back to top
Table 5: High Speed, Eight Lane Divided Roadways (w = 48 feet), emax = 6%, NC = 2.5%
High Speed, Eight Lane Divided Roadways (142.21 KB) .pdf
Back to top
Table 6: Ramps (w = 16 feet) and Loops (w = 18 feet), emax = 6%, NC = 2%
Back to top
Table 7: Ramps (w = 24 feet), emax = 6%, NC = 2%
Back to top
Table 8: Low Speed Roadways (w = 12 feet), emax = 8%, NC = 2%
Low Speed Roadways (179.95 KB) .pdf
Back to top
Table 9: High Speed Roadways (w = 12 feet), emax = 8%, NC = 2%
High Speed Roadways (218.54 KB) .pdf
Back to top
Table 10: Minimum Radii, Low Speed Roadway
|
| Transition design from a normal crown roadway to a superelevated roadway for low speed roadways using Method 2 distribution for side friction and superelevation is the same as high speed roadways. See Section 2B-2 for distribution details. |
|---|
Back to top