Content Information
On this page...
5C-1 Earthwork Quantity Calculation Process
Table 5C.1 Shows guidance on the process the designers should follow to perform Earthwork Quantities.
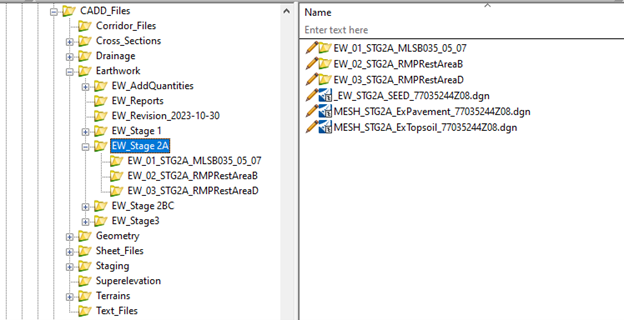
Below is an example of Earthwork folder structure here.
5C-2 Iowa DOT Earthwork Videos
The ODAC has created training videos related to earthwork calculations for reference and training purposes. Designers can access the complete playlist in the You Tube Channel under Iowa DOT MicroStation ORD Connect Earthwork Videos (Video Num).

Video 1: Creating a Closed Mesh
Video 2: Creating a Clipped Mesh
Video 3: Trimming a Mesh
Video 4: Editing Terrains
Video 5: Earthwork by Named Boundary
Video 6: Earthwork by End Area Report
Video 7: Flooded Backfill Part 1
Video 8: Flooded Backfill Part 2
Video 9: Flooded Backfill Part 3
Video 10: Flooded Backfill Part 4 Flowable Mortar
Video 11: Flooded Backfill Part 5
Video 12: Creating Cross Sections (XS) Sheets
Video 13: Cross Section Sheets Creation
Video 14: Adding Earthwork Tables to XS Sheets
Video 15: Earthwork T-Sheets
Back to top
5C-3 Earthwork Excel Spreadsheet Files
See the following video for information on how export ORD reports into the Iowa DOT Earthwork Excel Spreadsheet,
https://www.youtube.com/watch?v=u1JCHgCXFVI&list=PLurY2WfsVWKnbAoY_PEGizz9Zg1_PikDA&index=15
Describe Colors
The Data Information Sheet.
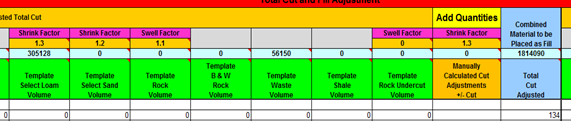
Figure 5C.1: Data Information column headings.
Hovering over any cell with a red triangle in the upper left-hand corner will provide information about that column.
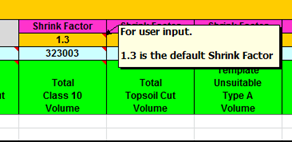
Figure 5C.2: Comments describe column purpose.
Orange Column Headings
Many places within the sheet are colored orange. These cells indicate either data is necessary from the user, or that data may be changed by the user. Figure 5C.2 shows some of the shrink factors on the sheet. They are orange and contain what has been predetermined to be the most common factor used for those soil types. The shrink factors can be changed by the user, though, if it is determined that a particular soil type on the project has a different shrink factor than the standard.
Green Column Headings
The green column headings indicate that the data below them are nothing more than summations for the original data from GeoPak.
Blue Column Headings
The blue headings indicate that a calculation was performed to manipulate the data. The cells below the blue headings should never be altered. If a quantity needs to be adjusted, either an orange column value needs to be changed, or users should clear out the Earthwork file, make adjustments in the cross sections, run the necessary input files again, and reimport the changed data. Overriding formulas may result in the changed quantities not transcending throughout the project properly.
Add Quantities
The Data Information Sheet contains two “Add Quantity” columns that are for the user to use to manually calculated quantities. One is for the Cut side and one is for the Fill side. These columns can contain “+” or “-” quantities. Examples of manually calculated items include entrances and dikes.
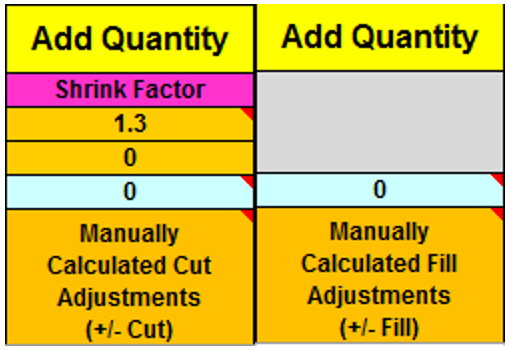
Figure 5C.3: Add Quantity column headings.
Weighted Average Shrink Factor
The Factor shown in an orange cell is the default factor that should meet most needs. If the number needs to be changed to match what is provided by the soils design group, the user just inputs the number needed into the cell.
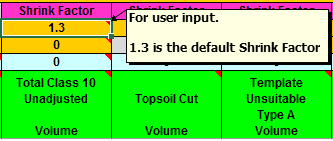
Figure 5C.4: The Factor for calculating the Weighted Average Shrink.
The orange cell below the factor cell is the quantity from which the weighted factor formula calculates. This number defaults with a formula equaling the total volume shown in light blue cell below it. If the user is going to waste part of the cut quantity, the user needs to change the volume in the orange cell to the volume of material that is going to be used for fill.
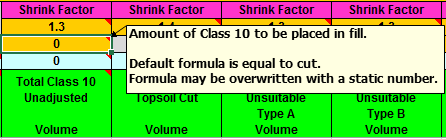
Figure 5C.5: The volume for calculating the Weighted Average Shrink.
The Weighted Average Shrink Factor is based on the formula multiplying the factor and the volume of each column being placed as fill (the number directly under the factor), adding the quotient for each column together, dividing the sum of the quotients by the sum of all the cut volumes placed as fill (the numbers directly under the factors), and rounding the final number to 2 decimal places. The weighted average factor is then applied to the Total Fill Adjusted as shown below.
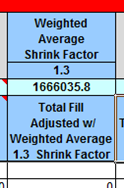
Figure 5C.6: Shrink heading example.
Placement of Unsuitable Soil Types
The Unsuitable Placement Check is for the user to be able to determine the amount of unsuitable material that can be placed according to Standard Road Plan EW-102.
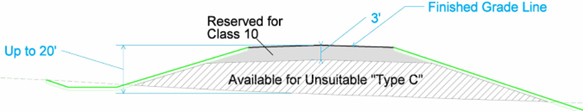
Figure 5C.7: Example of Unsuitable placement calculation.
The user will enter minimum end areas of Class 10 fill (shaded gray in the above example) needed for each unsuitable placement situation (5 foot Minimum, 20 foot Maximum, 3 foot Minimum). For instance, some unsuitable “C” material can be placed anywhere more than 3 feet below the subgrade. The user draws a line 3 feet below the subgrade line and floods the area. This is the minimum amount of Class 10 needed at this cross section to be entered in the calculation file. The remaining fill area is available for unsuitable “C” placement (hatched in the above example), and is provided by the calculation file. Users need to pick a typical cross section that is representative of the project. It is not necessary to enter a value at every station. However, if the project has large changes, it may be proper to adjust the values, and independent roadways should all have individual values.
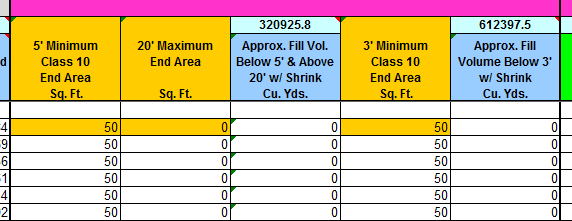
Figure 5C.8: Check for unsuitable soil placement.
Large Core-Out Areas. The calculation file does not account for add quantities in the unsuitable placement columns (labeled above as “Approx. Fill Vol. Below 5’…”), making the volumes generally conservative. However, this may not be appropriate for areas with large core-outs. For projects with core-out volumes where 10,000 cubic yards or more of unsuitable material could be placed, the designers will need to manually adjust the fill volumes in the station ranges appropriate.
Topsoil Column Headings
The Topsoil columns show the typical thickness of cut and replacement, the replacement with shrink, and the difference of the cut minus the replacement with shrink. There is no user input here unless it is necessary to change the Shrink Factor for the topsoil.
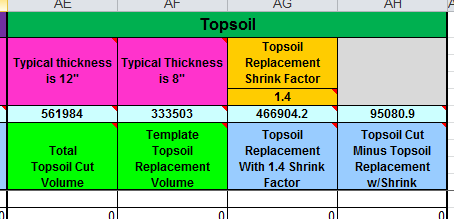
Figure 5C.9: Topsoil Column Headings.
User Calculations
This sheet is primarily for the user to be able to do whatever hand calculations are needed for Earthwork, to be able to link back to the information from the DataInformation Sheet, and to ensure that the calculations showing the information are passed along with the Earthwork to the field.
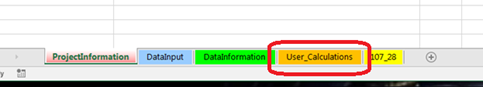
Figure 5C. 10: Tab Sheet Production.
The Add-Ins menu of the DataInformation sheet has two drop down menus: Tab Sheets and T-Sheets.
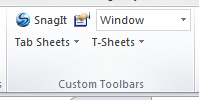
Figure 5C.11: Add-In menu on DataInformation sheet.
The Tab Sheets has 3 choices: Build Tab Sheets, Rebuild Single Tab Sheet Only, and Rebuild Summary Tab Sheet Only. The Build Tab Sheets will create/recreate ALL the Tabs Sheets. The Rebuild Single Sheet Only recreates a single Tab Sheet and rebuilds the Summary. The Rebuild Summary Tab Sheet Only will recreate the Summary sheet once the user rearranges the Tab Sheets.
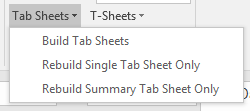
Figure 5C.12: Tab Sheets tools.
After the Build Tab Sheets tool has been run, a grey colored Tab Sheet for each roadway appears across the bottom of the workbook, including the Summary sheet at the end. These are in the order in which the roadways are listed in the ‘DataInformation’ sheet.
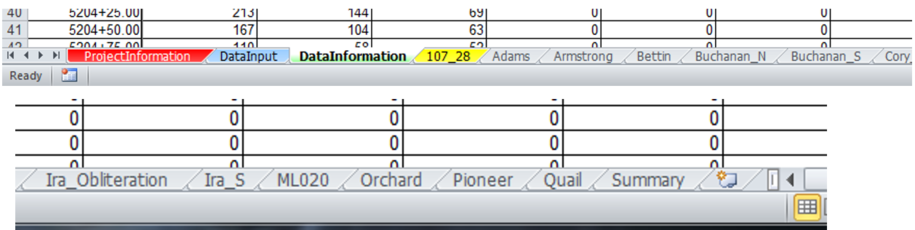
Figure 5C.13: Sheets for each roadway.
After replacing a roadway, the user will need to update the roadway tab. To do this, select the roadway title and then select Rebuild Single Tab Sheet Only. This will clear the information out of the existing roadway tab sheet and replace it with the updated information. It will run the summary update as well so that both are updated at the same time.
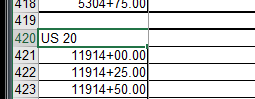
Figure 5C.14: Roadway title.
The summary sheet order is created off of the order of the sheets for each roadway shown in Figure 5C.15.
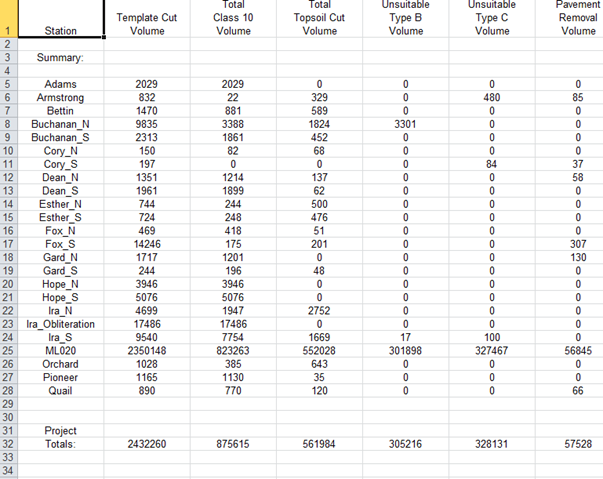
Figure 5C.15: Summary Sheet.
See how the Summary Sheet in Figure 5C.16 looks different than Figure 5C.15 after the Roadway Tabs have been rearranged.
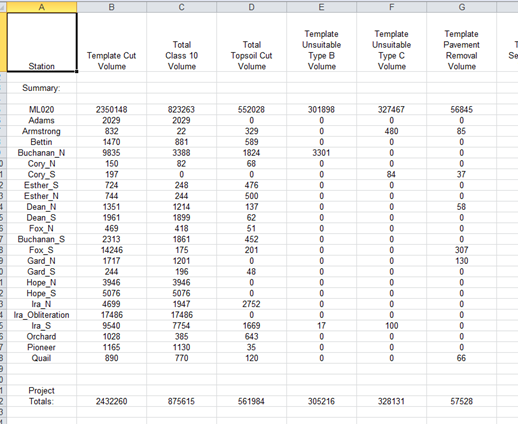
Figure 5C.16: Summary Sheet.
T-Sheet Production
The T-Sheets drop down menu contains two options: Build T-Sheets and Build Summary Sheet Only.
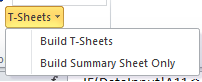
Figure 5C.17: T-Sheets Menu
The Build T-Sheets creates the final sheets on the 107_28 Tabulation that will be submitted with the plan. It also creates a Summary sheet at the end. Each roadway will start on a new page. See https://iowadot.gov/design/dmanual/01f-20.pdf for formatting
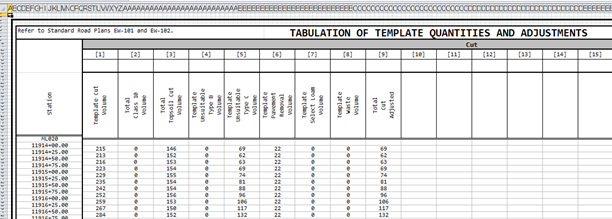
Figure 5C.18: Roadway T Sheet.
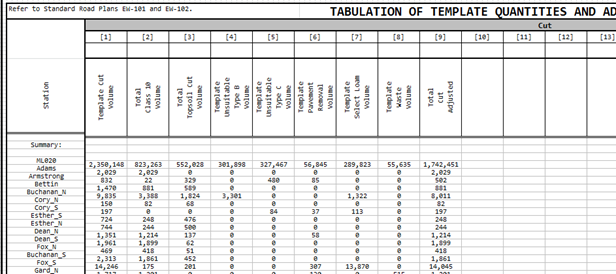
Figure 5C.19: Summary T Sheet.
Some projects will either produce single sheets or a double sheet. The sheet numbers for both are shown below. The sheet numbers are set when the final sheets are processed. A dialog box will pop up asking for the beginning sheet number.
Single Sheet Project:
Figure 5C.20: T.1 Sheet
Double Sheet Project:
(To accommodate more columns for soil layers)
Figure 5C.21: T.1A Sheet (Cut Columns)
Figure 5C.22: T.1B Sheet (Fill Columns)
The 107_28 sheet has 2 drop down menus, see Figure 5C.23.
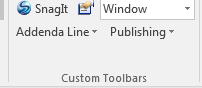
Figure 5C.23: Final sheet.
The Addenda Line drop down is for adding an addenda line or removing an addenda line to the bottom of a sheet, see Figure 5C.24.
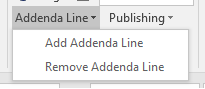
Figure 5C.24: Final Sheet – Addenda Line drop down.
To add or remove the Addenda Line, the user selects a cell within the sheet and selects to add or remove the line, see Figure 5C.25.
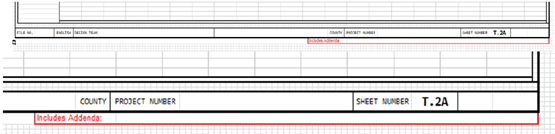
Figure 5C.25: Addenda line.
The Publishing drop down contains 2 options for publishing the final sheets, see Figure 5C.26.
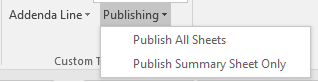
Figure 5C.26: Final Sheet – Publishing drop down.
The “Publish All Sheets” works like the previous button, “Publish Sheets”, in that it publishes all the sheets on the final 107_28 tab.
The “Publish Summary Sheet Only” button is designed so the user can publish just the Summary Sheet of the final plan sheets. This allows the user to do so without having to run the Summary Sheet tool which would delete any roadway totaling that had already been done.
For either option, a dialog box like the one shown in Figure 5C.27 below will appear for the user to choose where to create the .pdf.
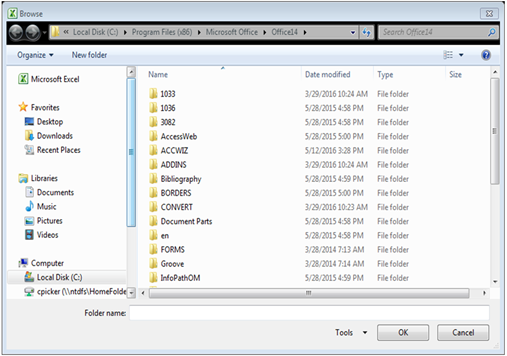
Figure 5C.27: Prompt for .pdf creation location
Back to top