Content Information
On this page...
Models
Each MicroStation file contains numerous models. Models allow the information contained in the file to be categorized for easier use by the customer. You can think of the MicroStation file as a notebook and the models as sheets within this notebook. When you open the “.sur” file for the first time you should be in the Field_Project_Overview model. When first creating your datasets and importing the field information into GEOPAK, this is where everything will be drawn. After the field survey is done and all of the information is correctly loaded into GEOPAK, you can delete all of the elements from this model. You are now ready to place the survey information into its correct and final model.
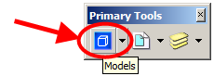
To change models, click the blue Models button on the Primary Tools tool bar.
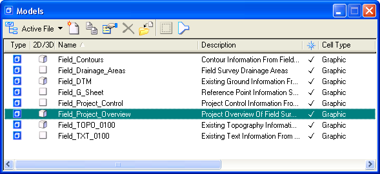
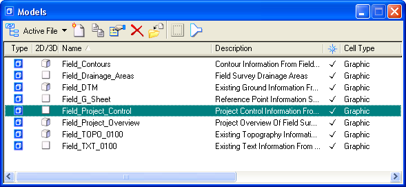
This will open the Models dialog. The model highlighted in green is the active model and should initially be the Field_Project_Overview model when the file is opened for the first time.
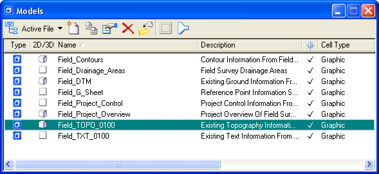
Field_TOPO_0100 model
In the Models dialog box, double-click on Field_TOPO_0100 to open the model.
Double-clicking the model name should open the model and also cause it to become the active model. We will now draw all of the field collected survey data related to the TOPO (plan view) model.
Geopak Survey menu
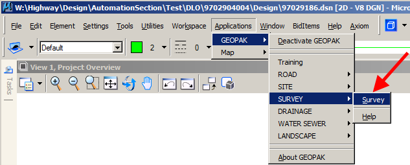
Start GEOPAK from the MicroStation menu by selecting Applications > GEOPAK > Activate GEOPAK, as shown at the right.

After GEOPAK has been activated, access the GEOPAK Survey menu from the MicroStation menu by selecting Applications > GEOPAK > SURVEY > Survey, as shown at the right.
The Survey menu should display, as shown below.
Back to topVisualization
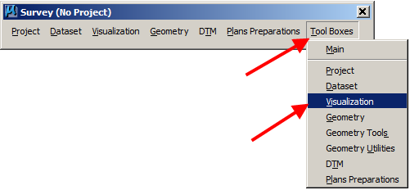
- From the Survey menu tool bar, select Tool Boxes > Visualization, as shown at the right.
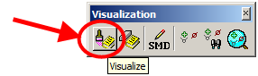
The Visualization tool will open, as shown below.
- On the Visualization tool bar click the Visualize tool.
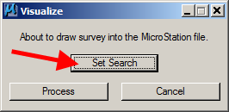
This will open the Visualize dialog box, as shown below.
Set Search
Click the Set Search button on the Visualize dialog.
This will open the Set Search dialog box, as shown below.
Select Datasets
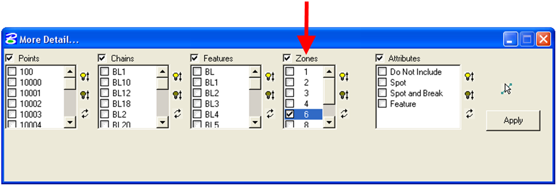
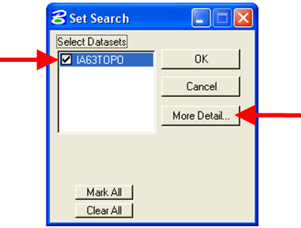
On the Set Search dialog, select the datasets that you want to draw into this model. You can usually click the Mark All button to select all of the datasets because we want to draw all of the items related to this model. After selecting the correct datasets, click the More Detail button. This will open the More Detail… dialog box, as shown below.
More Detail
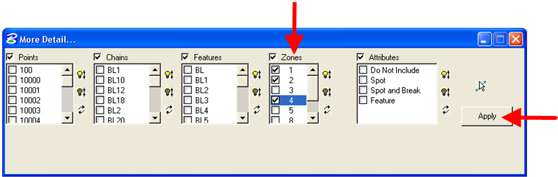
Now it is time to pick what Zones belong in this model. “Zones” is a GEOPAK term and it means “a group of like objects”. For a full description of which zones are placed in which model(s), see the instruction file ZoneAndColorDesc.pdf. For the Field_TOPO_0100 model, you want to select zones 1, 2, 4 and 8. Click the Apply button and the More Detail… dialog box will go away.
Process
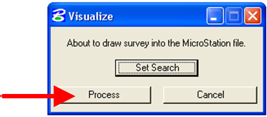
Click the Process button on the Visualize dialog box. All of the survey items from Zones 1, 2 and 4 will now be drawn into the MicroStation model.
Field_Project_Control model
In the Models dialog box, double-click on Field_Project_Control to open the model.
Repeat steps 4B, 5, 6, 7, and 8 for the Field_Project_Control Model
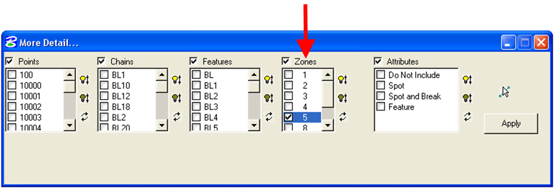
Click on the Visualize button, Set Search, select datasets, and press More Details as in steps 4B, 5, 6, 7, and 8, above. Then make sure that zone 5 is the only one checked (R) for the Field_Project_Control model. Click the Apply button. Then click Visualize > Process, as in step 8, above. All of the survey information from zone 5 is now drawn into this model.
Field_DTM model
In the Models dialog box, double-click on Field_DTM to open the model.
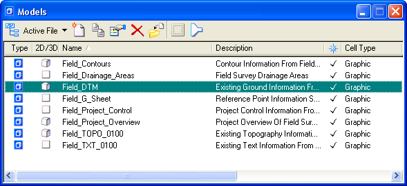
Repeat steps 4B, 5, 6, 7, and 8 for the Field_DTM model
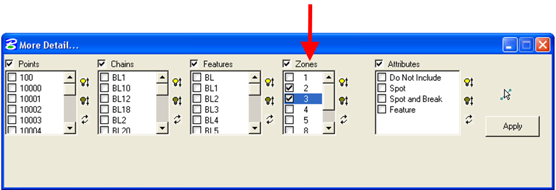
Click on the Visualize button, Set Search, select datasets, and press More Details as in steps 4B, 5, 6, 7, and 8, above. Then make sure that zones 2 and 3 are the only ones checked (R) for the DTM model. Click the Apply button. Then click Visualize > Process, as in step 8, above. All of the survey information from zones 2 and 3 are now drawn into this model.
Field_Drainage_Areas model
In the Models dialog box, double-click on Field_Drainage_Areas to open the model.
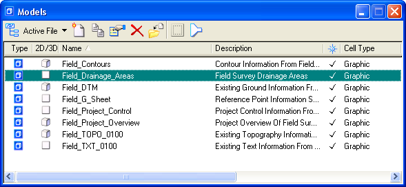
Repeat steps 4B, 5, 6, 7, and 8 for the Field_Drainage_Areas model
Click on the Visualize button, Set Search, select datasets, and press More Details as in steps 4B, 5, 6, 7, and 8, above. Then make sure that zone 6 is the only one checked (R) for the Field_Drainage_Areas model. Click the Apply button. Then click Visualize > Process, as in step 8, above. All of the survey information from zone 6 is now drawn into this model.